

For those of you who have been reading my previous blogs on various aspects of financial decisions and interventions for urban low-income household, we are back with some field observations, findings, and preliminary thoughts. To give a quick recap, our project “Decoding financial lives of Urban Poor” was to systematically understand the financial profile of low-income households (LIHs) living in the slums of Chennai and to think of interventions that could potentially assist these households to be financially better off. This study captured information on their occupation, income patterns, asset and liabilities, risk management techniques, spending, consumption patterns and participation in institutional and non-institutional financial markets. From a financial inclusion point of view, the agenda of ensuring last-mile delivery of financial products and service are usually targeted towards the rural low-income household and rightly so. However, when it comes to serving the LIHs in urban pockets of cities, it is usually assumed by service providers and regulators that there will be a trickle down effect of financial services from higher to lower wealth classes due to proximity from the bank branches, head offices along with the hope that the ubiquitous presence of digital financial service can become a leveler to bridge this gap. The larger goal of this project was to understand the extent to which slum population has been financially included by the institutional markets and if not, then what are the opportunities to serve them better. For instance, in this blog we will delve deeper into the extent to which LIH in Chennai owns a physical asset in the form of gold and what are some of the markets opportunities that stem from it.
Anybody who has conducted research in this space knows that information on household income, occupation and other financial details particularly of slum households is not easily available or traceable. To conduct this study, we decided to conduct mixed frequency primary surveys of more than 200 households in four slums of Chennai. Our first instrument was an initial primary survey (which we also refer to as baseline), followed by a fortnightly based financial diary. We used a multi-stage sample selection of slums and households using probability proportional to scale method and other inclusion/ exclusion filter criteria.
Our initial survey was conducted to recruit households as well as capture information regarding various aspects of the socio-economic aspects of their livelihood as on that date. In this blog, we present to you some findings from the initial survey.
Let’s begin with getting the lay of the land.
In our sample, the structure of a typical family was usually nuclear with an average family size of 4 members (Graph 1). On average, our sample population[1] covered was relatively young with most members in the age group of 20–30 years, indicating either a sizeable volume of either working/actively looking for work or dependent population (Figure 1).


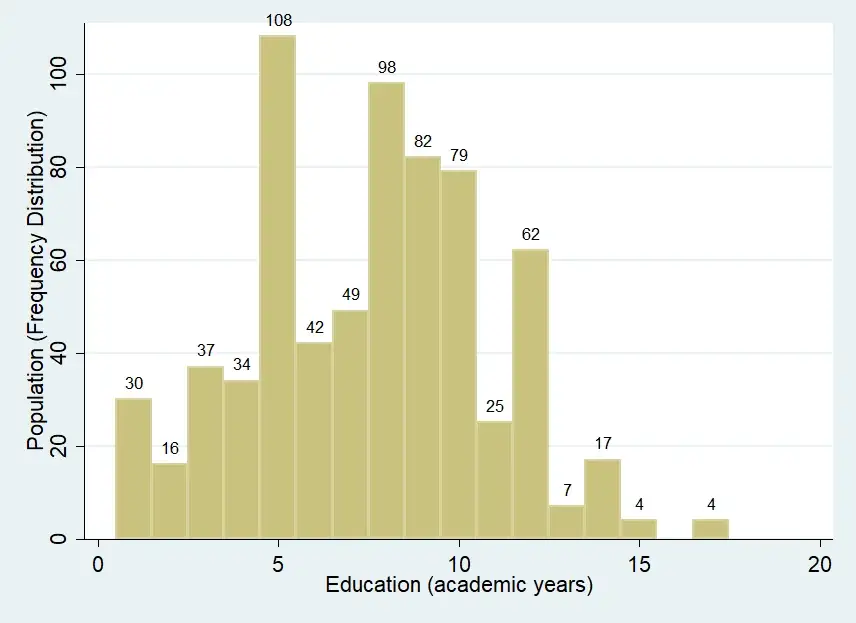
A considerable section of the population who have ever enrolled in a school have dropped out midway, however, some have pursued till higher standards till 10th and 12th (Graph 3).
In the slums that we surveyed, the majority of the families have been living there for more than two decades and a sizeable portion of the population have reported being residing on encroached public land. These slums are based near sewage canals, under flyovers and next to burial grounds which is indicative of the extent of livelihood vulnerability, exposure of health and other shocks and a non-conducive environment for facilitating sustained education. Financially speaking, absence of house ownership documents can limit access to traditional financial products despite residing in the locality for a significant number of years. The microfinance industry has been able to make some headway for this population segment in the standard microcredit segment but w.r.t. other products like savings (through bank account opening) and insurance (apart from state-led insurance) and pension remains to be a challenge.
To understand their means to access various scheme benefits, financial products, and rations, the survey also collected data on possession of various forms of identification documents (Graph 4). In our sample, almost 87% of the population had an Aadhar card and almost exact share of the population did not hold a PAN card and all PAN cardholders were also Aadhar cardholders! Most of the family had a ration card as anticipated and there is wide adoption of smart ration card. (In our previous blog we have discussed the potential to leverage ration shops and card to generate more Cash In Cash Out points[2] and payment gateways)

In the upcoming blogs, we will write on particular aspects of the households’ financial portfolio choices and decision making and try to understand their rationale behind their choices better. In this blog, we discuss the ownership and usage of gold by our respondent families at the baseline. As per the NSSO data[3] on the household expenditure on services and durable good, an average household in Tamil Nadu spends Rs. 5636[4] in a year on gold either for domestic purpose or for recreational purpose.
In our survey, around half of the sample owned gold with an average holding of gold of 12.3 gms (Graph 5), worth Rs. 47,000 (Graph 6). (For contextual reference, 12 gms of gold could be thought of as a pair of medium-sized earrings!) More than 90% of the gold was acquired as gifts during weddings or other ceremonies and are either worn or pawned at the jeweler. In our conversations, we found that gold was barely stored at home due to fear of theft. Slum Dwellers either wear the jeweler or keep it pawned at the pawn/jeweler shops. Since slum settlements are packed tightly, women often fear incidents of snatching, theft or appropriation of gold by their husbands for illicit activities.


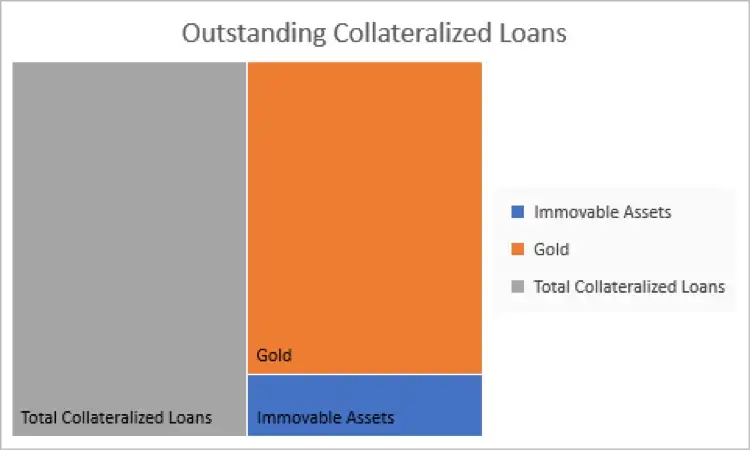
In the initial months of our survey, we observed few instances where few families used gold as an instrument for fulfilling social obligations as well as a risk management tool. We also observed that ownership of gold was higher in families with higher female members. In our survey families considered gold to be a highly liquid and value generating asset, despite existing concerns of safety. Infact, 83% of all outstanding collateralized loans held by the sample was pledged against gold and the remaining 17% of the loans were against immovable property (Graph 7).
As conventional wisdom would tell us, gold is an instrument that provides a moderate hedge against inflation (in a non-volatile economy) and also provides agency to women who are then motivated to undertake independent financial decision. However, LIHs like our sample used gold as dual-purpose durable commodity, that is they used it to access quick liquidity to fulfill consumption expenditures as well as an insurance commodity against shocks. As much as individuals with basic knowledge of macroeconomics conditions would save in gold for hedging against inflation (investment purpose) , slums households most likely use it for its store of value properties (precautionary purpose). These behaviours are reinforced by the widespread presence of pawn shops, cultural and peer motivations, as well as the young composition of the slum member. Badarinza et. al (2016)[5] find that in India the share of gold in personal financial portfolio is highest among the younger groups (between 24 to 35).
This is a good time to review one of the recommendations around efficiently leveraging gold as an asset as discussed in the Household Finance Committee Report, RBI and in the 2018–19 budget session. The report mentions that there is a need for spot gold exchange to promote gold market liquidity so that households can more efficiently monetize their gold holding. This can facilitate (a) better price discovery and (b) standardization of gold prices across the country which will allow household to determine the value of their gold holdings and protect them from selling or collateralizing at incorrect prices. Currently, the Indian Bullion Jeweler Association are the authorities to set the price of gold on a regular basis. Spot Exchange will also create greater transparency among buyers and sellers of this asset.
In our context, creation of spot exchange at a large systemic level can also safeguard low-income households at the bottom of the pyramid against differential prices levied by local shops, better information symmetry and protect the limited gold holdings that these households possess.
References
[1] In the baseline survey, information was collected for 927 individuals from 229 families. [2] Cash In Cash Out refers to the activities traditionally offered by ATMs and bank branches where customers can deposit or withdraw cash from their account. In recent time there has been a greater push for creating more CICO points to bridge the gap between digitally and non-digitally serviced customers under the financial system. [3] NSSO Round 72 Household Expenditure of Good and Services [4] Gold ownership as captured by this dataset have very high outlier values. To calculate this value, we used the value of gold possessed by households in Tamil Nadu adjusted by population weights. [5] Badarinza, C., Balasubramaniam, V., & Ramadorai, T. (2016). The Indian Household Savings Landscape. Available at SSRN 2797680.